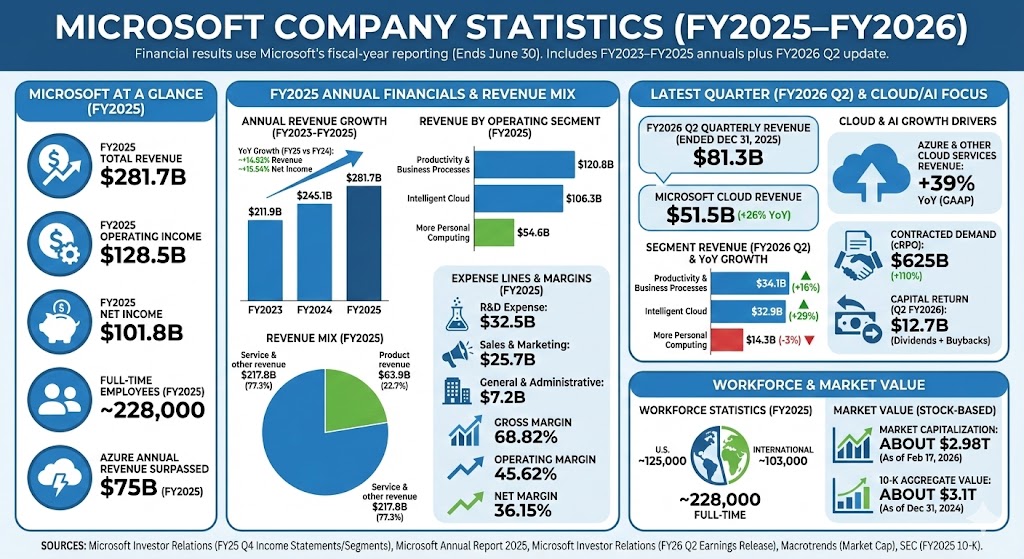
Microsoft’s fiscal year ends on June 30. The financial results below use Microsoft’s fiscal-year reporting (FY2023–FY2025), plus the most recent quarterly update available for FY2026.
Microsoft company statistics Metric Value FY2025 total revenue $281.7B FY2025 operating income $128.5B FY2025 net income $101.8B FY2025 gross margin $193.9B FY2025 R&D expense $32.5B Employees (full-time, FY2025) ~228,000 Azure annual revenue milestone (FY2025) Azure surpassed $75B Latest quarter reported (FY2026 Q2) Revenue $81.3B; Microsoft Cloud $51.5B
Revenue mix: Product revenue $63.9B vs. Service & other revenue $217.8B (FY2025).Expense lines (FY2025): R&D $32.5B; Sales & marketing $25.7B; General & administrative $7.2B.Margins (FY2025): Gross margin 68.82%; Operating margin 45.62%; Net margin 36.15%.YoY growth (FY2025 vs FY2024): Revenue ~+14.93%; Net income ~+15.54%.
Label Bar Value FY2023
$211.9B FY2024
$245.1B FY2025
$281.7B
Max = $281.7B. Widths: FY2023 75.22%, FY2024 87.01%, FY2025 100.00%.
Label Bar Value Productivity & Business Processes
$120.8B Intelligent Cloud
$106.3B More Personal Computing
$54.6B
Max = $120.8B. Widths: Productivity & Business Processes 100.00%, Intelligent Cloud 87.96%, More Personal Computing 45.24%.
Quarterly revenue: $81.3B (quarter ended Dec 31, 2025).Microsoft Cloud revenue: $51.5B (+26% YoY).Segment revenue (Q2 FY2026): Productivity & Business Processes $34.1B (+16%); Intelligent Cloud $32.9B (+29%); More Personal Computing $14.3B (-3%).Azure growth (Q2 FY2026): Azure and other cloud services revenue +39% YoY (GAAP).Contracted demand: Commercial remaining performance obligation (cRPO) $625B (+110%).Capital return: $12.7B returned to shareholders in Q2 FY2026 (dividends + buybacks).
Total employees (FY2025): ~228,000 full-time.Employee location split (FY2025): ~125,000 in the U.S. and ~103,000 internationally.
Market capitalization: About $2.98T (as of Feb 17, 2026).10-K cover-page metric: Aggregate market value of shares held by non-affiliates was about $3.1T (as of Dec 31, 2024, per FY2025 10-K cover page).
Microsoft Investor Relations (FY25 Q4) – Income Statements: https://www.microsoft.com/en-us/investor/earnings/fy-2025-q4/income-statements
Microsoft Investor Relations (FY25 Q4) – Segment Revenues: https://www.microsoft.com/en-us/investor/earnings/fy-2025-q4/segment-revenues
Microsoft Annual Report 2025 (high-level FY2025 highlights, incl. Azure): https://www.microsoft.com/investor/reports/ar25/index.html
Microsoft Investor Relations – FY26 Q2 Earnings Release (Jan 28, 2026): https://www.microsoft.com/en-us/investor/earnings/fy-2026-q2/press-release-webcast
Macrotrends – Microsoft market cap (date-stamped): https://www.macrotrends.net/stocks/charts/MSFT/microsoft/market-cap
SEC (FY2025 10-K, employee count excerpted): https://www.sec.gov/Archives/edgar/data/789019/000095017025100235/msft-20250630.htm